
On this page
Bitcoin hashrate describes how quickly miners are trying hashes. Mining difficulty describes how demanding the network’s proof-of-work target is. The first is a rate, usually estimated for the whole network; the second is a dimensionless measure calculated from a rule that nodes enforce.
That distinction explains why a hashrate chart can move while difficulty stays flat. A changing estimate is not an immediate difficulty adjustment, and neither number tells you where Bitcoin’s price will go.
This guide covers Bitcoin mainnet, not the different rules of other proof-of-work networks or Bitcoin test networks.
Compare the units first
A hash is one attempt to find a block header that meets Bitcoin’s proof-of-work requirement. Hashrate, also written “hash rate,” counts attempts per second. Difficulty compares the current target with a fixed reference target: higher difficulty means a smaller acceptable target and more attempts needed on average. Bitcoin’s block-header reference and Bitcoin Core’s difficulty calculation describe these different quantities.
| Question | Network hashrate | Network difficulty |
|---|---|---|
| What does it describe? | The network’s estimated hashing speed over a stated window | How hard the current proof-of-work target is relative to the difficulty-one reference |
| What are the units? | Hashes per second, often TH/s, PH/s or EH/s | A ratio with no physical unit |
| Where does the number come from? | An estimate using accepted blocks, their work and timing | The target encoded in block headers and the consensus retarget rule |
| When can the displayed number change? | When the observation window, new blocks or provider calculation changes | At a 2,016-block retarget boundary on mainnet; the value can also remain unchanged |
| What does it leave out? | An exact count of every miner’s attempted hashes | Current hashing speed, electricity use, miner profit and Bitcoin’s price |
The prefixes matter: 1 TH/s is 10¹² hashes per second, 1 PH/s is 10¹⁵, and 1 EH/s is 10¹⁸. Therefore, 1 EH/s equals 1,000 PH/s or 1,000,000 TH/s. A difficulty value described as “trillions” is still a ratio, not trillions of hashes per second.
Why network hashrate is an estimate
Miners do not publish a record of every unsuccessful attempt. The blockchain records accepted blocks and their proof-of-work targets. A network estimate works backward from that evidence to a rate.
For example, Bitcoin Core 30.0’s getnetworkhashps documentation specifies an estimate based on a selectable block window. Its default is 120 blocks; the value −1 selects the period since the last difficulty change. A chosen block height lets the caller estimate an earlier point rather than the current chain tip.
The versioned implementation divides the difference in accumulated chain work by an elapsed-time measure. It uses the maximum and minimum block timestamps in the selected sample. That is evidence about work and time, not a direct meter attached to every mining machine.
The same amount of work can imply different rates
Consider two hypothetical observation windows with the same 7.2 × 10²⁴ units of expected hash work:
| Hypothetical window | Elapsed time | Work divided by time | Estimated rate |
|---|---|---|---|
| A | 72,000 seconds, or 20 hours | 7.2 × 10²⁴ ÷ 72,000 | 100 EH/s |
| B | 60,000 seconds, or 16 hours 40 minutes | 7.2 × 10²⁴ ÷ 60,000 | 120 EH/s |
Window B’s estimate is 20% higher. These are illustrative calculations, not Bitcoin observations. They do not prove that machines were added: random variation in block discovery can also make an observed window faster or slower.
A short window reacts quickly but is more affected by that variation. A longer window smooths the picture but may take longer to reflect a real change. Two providers can therefore report different estimates without either having a different consensus rule. Before comparing their figures, match the window, end height, units and calculation method.
What difficulty actually controls
To satisfy proof of work, a block header’s hash must be less than or equal to the required target. Making that target smaller reduces the range of successful hashes. Difficulty expresses that change relative to a fixed baseline; it does not make each individual hashing operation a different kind of computation.
A useful simplified relationship is:
Difficulty = difficulty-one reference target ÷ current target.
If the target is halved, difficulty doubles. If a miner’s hashing rate stays unchanged, the expected time for that miner to find a qualifying hash increases. “Expected” matters: a particular block may arrive quickly or take much longer. Bitcoin’s proof-of-work explanation describes this probabilistic process.
Do not read “difficulty doubled” as “the network now uses twice as much electricity.” A difficulty ratio contains no measurement of hardware efficiency, energy prices or how many machines are currently running.
Why hashrate can move before difficulty
Bitcoin mainnet targets an average block interval of 600 seconds, or ten minutes. Its retarget period is 2,016 blocks, corresponding to a target timespan of 1,209,600 seconds, or fourteen days. These are mainnet parameters, not a promise that every block takes ten minutes or every adjustment occurs on the same weekday.
The sequence is easier to follow in three steps:
- During a retarget period, the network target stays fixed. Miners can switch equipment on or off without immediately changing it.
- If actual hashing power increases at that target, blocks tend to arrive faster. A sufficiently responsive hashrate estimate may rise, although a short run of quick blocks can also be luck.
- At the next retarget boundary, nodes calculate the new target from the prescribed timestamps. A faster measured period leads toward higher difficulty; a slower one leads toward lower difficulty.
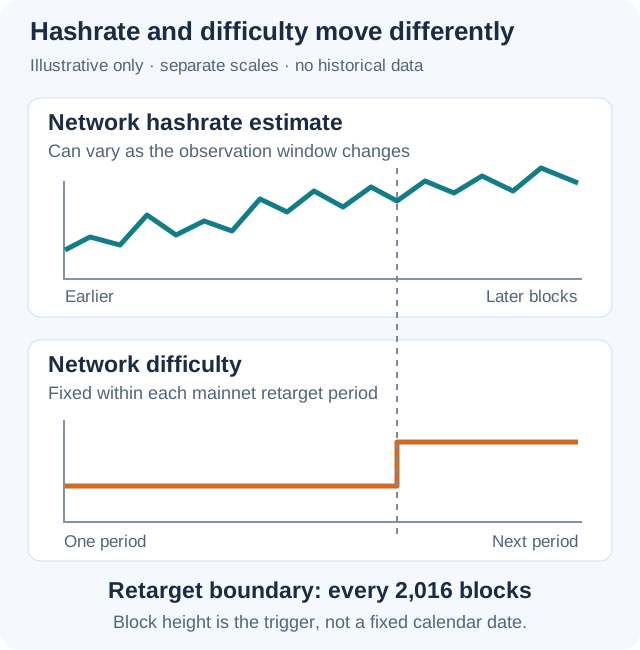
An adjustment estimate shown before the boundary is a forecast. More blocks and their timestamps can still change its result. The mainnet retarget implementation does not read a chart provider’s hashrate estimate to decide the next target.
A twelve-day retarget example
Suppose the timestamps used in the calculation span twelve days rather than the target fourteen. Ignoring compact-target rounding and assuming no limit binds:
- New target is approximately old target × 12 ÷ 14, or 85.714% of the old target.
- New difficulty is approximately old difficulty × 14 ÷ 12, or 116.667% of the old difficulty.
- An illustrative difficulty index of 100 would become about 116.667: a 16.667% rise, not a 14.286% rise.
The percentage fall in the target and percentage rise in difficulty differ because one is the reciprocal of the other. This is why copying the target’s percentage change into a difficulty headline gives the wrong answer.
Bitcoin also constrains the elapsed-time input to between one quarter and four times the target timespan. Compact encoding, integer arithmetic and the maximum permitted target matter for an exact implementation result. The example above explains the direction and ratio; it is not a replacement for the consensus calculation.
A technical detail about the 2,016-block period
The calculation uses timestamps from the first and last blocks of the prior 2,016-block period. Those endpoints span 2,015 gaps between blocks. The comparison timespan is still 1,209,600 seconds. “Every 2,016 blocks” is the adjustment cadence, not a claim that the endpoint subtraction measures 2,016 gaps. The versioned retarget code above shows the exact endpoint selection.
Pool share difficulty is a separate setting
A mining pool may ask its participants to submit hashes that meet an easier target than Bitcoin’s network target. These submissions, called shares, help the pool measure contributed work. Most shares do not qualify as valid Bitcoin blocks. A share that also satisfies the network target can be used in a block, provided the other block-validity requirements are met. Bitcoin’s mining guide explains the distinction.
Consequently, “difficulty” on a pool dashboard might mean share difficulty rather than network difficulty. Changing a participant’s share target does not change Bitcoin’s consensus target. Nor does a stream of accepted pool shares mean that the pool has found that many Bitcoin blocks.
If you are reading a dashboard, identify whose rate and target it shows: one machine, one pool or the network. Mixing those scopes makes otherwise correct numbers misleading.
A checklist for reading a mining chart
Before treating a movement as significant, ask:
- Which network? Confirm Bitcoin mainnet rather than another chain or a test network.
- Which quantity and unit? Separate hashrate, network difficulty, pool share difficulty and an estimated next adjustment.
- Which window? A 120-block estimate, a day-based estimate and a longer moving average answer different timing questions.
- Which endpoint? Record the observation time and block height. A cached value may not describe the same chain tip as another chart.
- Which method? Check whether the provider uses chain work, a simplified formula or a separately reported hardware/pool rate.
- Which conclusion? A network metric alone does not establish a price forecast or a miner’s return after costs.
For a mining-business question, you would also need the miner’s own effective hashrate, hardware efficiency, electricity and other costs, payout terms, subsidy, fees and the currency price used to value revenue. A network-difficulty chart is not that calculation.
For a price question, “more work” is not a complete market explanation. A rise in estimated hashrate can coexist with a falling price, and difficulty is a backward-looking adjustment rather than a promise of the next price movement.
Common questions
Does higher hashrate always mean higher difficulty?
Not immediately. Actual hashing power can change within a period while the network target stays fixed. Difficulty is recalculated at the next retarget boundary from the specified timestamps. A short-term rise in an estimate may also reflect randomness rather than a lasting change in computing power.
Why do two websites show different hashrates?
First compare their units, sample windows, end heights and methods. A network estimate is not an exact census of miners. Different windows can legitimately produce different figures from the same blockchain.
Does a difficult block take exactly ten minutes?
No. Ten minutes is the target average interval, not a timer attached to each block. Difficulty changes the probability that a hash attempt succeeds; it does not schedule the successful attempt.
Is difficulty the number of hashes required for a block?
No. Difficulty is a relative ratio, and the actual number of attempts before success varies. A work estimate can be derived from the target, but reading the difficulty number as a literal count of attempts is a unit error.
Does a halving automatically halve difficulty?
No. A halving changes the block subsidy under a separate height-based rule. Difficulty follows the 2,016-block retarget calculation. Miner behavior after a subsidy change may influence block timing, but the halving does not directly divide the difficulty by two.
Keep the metric and the conclusion separate
For the next chart you read, write down four things: the metric, its unit, its observation window and its block height. Then ask whether the claim concerns a measured estimate, an enforced rule or a forecast. That small check is more useful than treating every rising mining line as the same signal.
For further context, read how supply definitions change market cap and fully diluted valuation or why markets can react differently to the same news.
Keep learning
Explore educational guides to understand market concepts and evaluate claims.
Sources and scope
- Bitcoin developer guide: proof of work and block timing.
- Bitcoin block-header reference: target encoding and the valid-hash threshold.
- Bitcoin Core 30.0 RPC documentation: the network-hashrate estimate and its parameters.
- Bitcoin Core v30.0 source: hashrate calculation, difficulty calculation, mainnet parameters and retarget calculation.
- Bitcoin developer guide: mining pools and shares.
The code references are pinned to v30.0 for reproducibility, not presented as a claim about the latest Bitcoin Core release. Examples are hypothetical; this article provides no live hashrate, difficulty or profitability quote.
HypaForecast publishes educational guides and operates a prediction market. This guide explains Bitcoin mechanics, not an investment recommendation.
Share this guide