
Contents
PPDA means passes per defensive action. It compares the opponent’s passes with a team’s counted defensive actions in a defined part of the pitch. A lower PPDA means fewer opponent passes per counted action, so it is commonly used as an indicator of pressing intensity. It does not, by itself, tell you whether the press worked or the team defended well. Colin Trainor’s original method makes that distinction explicit.
Before comparing two PPDA figures, check three things: the provider’s event definitions, the pitch zone and the period covered. The ratio is simple; deciding whether the inputs are comparable takes more care.
The PPDA formula
PPDA = counted opponent passes ÷ counted defensive actions
Use the same method, specified pitch zone and time window for both counts.
For the team whose pressing you are assessing, the passes belong to its opponent and the defensive actions belong to that team. Do not divide the team’s own passes by its own defensive actions.
PPDA is a ratio, not a percentage or a time measurement. A value of 8 means eight counted opponent passes per counted defensive action across the sample. It does not mean every possession lasted exactly eight passes, or that a challenge occurred every eight seconds. Those conclusions require information the ratio does not contain.
Why the provider’s definition matters
There is no safe universal list of events to plug into every PPDA calculation. Wyscout’s glossary and Trainor’s 2014 implementation use different event labels. Both describe a high-press measure, but you should not assume their denominators are interchangeable.
| Method | Opponent passes and zone | Counted defensive actions |
|---|---|---|
| Wyscout glossary | Opponent passes that start in the specified final 60% from the pressing team’s perspective: the opponent’s defensive 60%. | Fouls, interceptions, won defensive duels and sliding tackles. |
| Trainor’s 2014 Beyond40 implementation, using Opta data | Opponent passes in the area beyond x = 40, with the pressing team attacking from left to right on a 0–100 pitch-length scale. | Tackles, interceptions, challenges (failed tackles) and fouls. |
Sources: Wyscout’s PPDA glossary and Trainor’s 2014 explanation.
The wording matters. “Won defensive duels” is not the same label as “challenges (failed tackles)”. Nor should “passes” silently become “completed passes”: Trainor explicitly says his calculation is not restricted to successful passes. Wyscout specifies where the opponent’s pass starts. If you are rebuilding a published figure, use that dataset’s event and location rules rather than filling gaps with another provider’s documentation.
Trainor’s article explains his historical method. It is not a specification for every current Opta product or for a current StatsBomb data feed simply because it appears in the StatsBomb blog archive.
Whose 60% of the pitch?
In these two methods, the relevant area extends from a point inside the pressing team’s own half to the opponent’s goal. It is the pressing team’s attacking 60%, which is the same physical area as the opponent’s defensive 60%. It is not the pressing team’s defensive 60%.
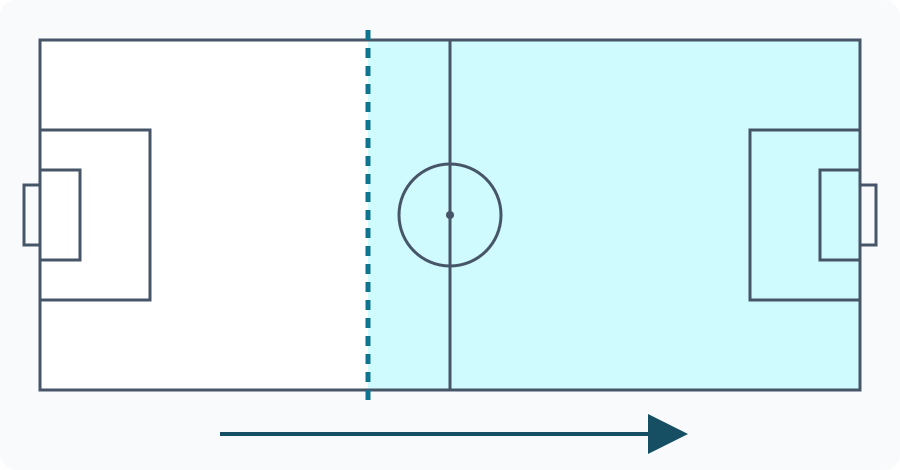
Direction: the pressing team attacks to the right.
Shaded area: attacking 60% for the pressing team; defensive 60% for its opponent.
Dashed boundary: x = 40 in Trainor’s orientation. His Beyond40 method uses x > 40. The solid centre line marks halfway.
The zone must apply to both sides of the fraction. Whole-pitch opponent passes divided by defensive actions from only the attacking 60% would be a different measure. When comparing another source, check its pitch orientation and boundary rather than relying on the abbreviation alone.
A worked example: 8 versus 12
Suppose one fictional dataset counts 240 opponent passes and 30 defensive actions in its chosen zone and period. Its PPDA is 240 ÷ 30 = 8. With the same 240 passes but only 20 counted actions, PPDA would be 240 ÷ 20 = 12.
Hypothetical counts, one consistent method
240 opponent passes ÷ 30 defensive actions
240 opponent passes ÷ 20 defensive actions
These are teaching figures, not team statistics. In Scenario A, the denominator is 30 defensive actions, not 30 possession recoveries. An action such as a failed tackle or a foul can enter a method’s count without being a successful ball recovery. The exact possibilities depend on that method’s event definitions.
If there are no counted defensive actions, the ratio has a zero denominator and is undefined. Do not record it as PPDA 0. Check how the provider displays or excludes such a sample before combining it with other observations.
Why a low PPDA is not automatically good defending
PPDA helps describe how a team engages opponents in a selected area. The outcome of that engagement is a separate question. There are four useful distinctions.
Activity is not success
A team can make frequent challenges without consistently regaining possession. Trainor included failed tackles and fouls because he was describing defensive activity, not building a success rate. Pair the ratio with what happened after the intervention: did the opponent lose the ball, escape pressure or continue progressing? The PPDA value alone cannot answer that. Original method.
Territory affects where actions happen
A team that spends much of a match high up the pitch may naturally make its defensive actions there. A low PPDA can therefore reflect territorial dominance as well as an aggressive pressing approach. Stats Perform highlights this problem and discusses field tilt, a measure based on the teams’ shares of final-third passes, as useful context. Do not treat a possession or territory measure as interchangeable with PPDA; use it to help explain the setting. Stats Perform’s pressure analysis.
Off-ball work is not fully captured
Closing a passing lane, moving together and steering play away from a dangerous area can matter without producing one of the counted defensive events. Stats Perform argues for combining measures because pressing involves coordinated movement beyond the player nearest the ball. A single event-based ratio cannot describe all of that work. How we measure pressure.
Match context changes the comparison
Before interpreting a difference, ask whether you are comparing the same situation. A side protecting a lead and a side chasing a goal are not making the same tactical decision. Note the score, red cards, opponent, possession and territory, and whether the figure covers a whole match or a particular period.
This is a reading checklist, not a claim that each factor changes PPDA by a fixed amount. A change in the ratio identifies something to investigate; it does not establish the cause. Use the match sequence and, where available, video to test your explanation.
Combining matches: why the average can mislead
If you want PPDA for a combined sample, divide the total eligible passes by the total eligible defensive actions. A simple average of match-level PPDA values answers a different question.
Consider two hypothetical matches measured with the same method:
| Sample | Opponent passes | Defensive actions | PPDA |
|---|---|---|---|
| Match 1 | 100 | 10 | 10 |
| Match 2 | 300 | 15 | 20 |
| Combined sample | 400 | 25 | 16 |
The pooled ratio is (100 + 300) ÷ (10 + 15) = 16. The simple average of the two match ratios is (10 + 20) ÷ 2 = 15. Neither calculation has an arithmetic error: they summarize the matches differently.
The pooled value gives more weight to the match with more counted defensive actions. Here, the equivalent calculation is (10 × 10 + 20 × 15) ÷ 25 = 16. This denominator-weighted identity assumes the individual ratios are defined and uses unrounded values.
A published season figure might use a different aggregation rule. Check its method instead of assuming that averaging the displayed, possibly rounded match values will reproduce it. If a match has a zero denominator, you cannot safely apply the weighted-ratio shortcut to its undefined PPDA; work from the raw counts and the provider’s inclusion rules.
A practical checklist for comparing PPDA
- Match the definition. Use one provider and a consistent method version. Check which passes and actions count, including unsuccessful events.
- Match the zone. Confirm the orientation, boundary and pass-location rule. Do not combine a whole-pitch figure with a high-zone figure as if they were identical.
- Match the sample. Identify the competition, opponents, dates, minutes or match periods, and the treatment of red cards. A short segment and a season are not equally informative.
- Check the aggregation. Is the number a ratio of pooled counts, a mean of match ratios or another summary? Keep the underlying counts when you can.
- Read the football context. Consider possession, territory and game state, then examine outcomes that matter to your question, such as recoveries, progression allowed or chances conceded.
The useful conclusion is usually narrower than “this team is better at defending”. For example: “Under the same method, Team A allowed fewer counted opponent passes per defensive action in this zone and sample.” Whether that approach was effective needs the next layer of evidence.
The takeaway
Use PPDA to ask how frequently a team intervenes in opponent possession within the provider’s chosen zone. Use the event definitions to understand what “intervenes” means, the raw counts to check the arithmetic and the match context to decide what the result tells you.
A lower ratio can indicate more intense pressing. It is not a universal quality score, a count of successful presses or a win probability.
Continue learning
Choose another explanation for the question you want to check next.
Sources
- Wyscout: PPDA glossary. Provider-specific pass-start, zone and defensive-event definitions.
- Colin Trainor: Defensive Metrics: Measuring the Intensity of a High Press, 30 July 2014. The historical Beyond40 implementation using Opta data.
- Stats Perform: How we measure pressure. Territorial and off-ball limitations of single-metric pressing analysis. Its team examples are historical; none are used as current rankings here.
HypaForecast publishes educational guides and operates a prediction market. This page is an educational explanation.
Share this guide